24/7 News Means we are Consuming it 24/7 (Almost)
To say that news media is pervasive is an understatement. It figures into every aspect of our lives. The TV in the airport terminal blasts CNN. Our smartphones are constantly pinging us with the headlines through push notifications. Increasingly, smart speakers with screens pump the day’s events into your home. Your podcast feed grows thicker by the hour. The interminable scroll of social media is chock with news tidbits, headlines, and other ephemera. The tried-and-true radio soothes us (or riles us up) with news stories on our commute to and from work. The cornucopia of cable news channels is available to us as we eat dinner. Youtube’s unending series of recommendations leads to a gluttony of news information that we can stream on auto-play.
To put it mildly, Americans (if not the world – later study) are obsessed with the news. In fact, 94% of all respondents surveyed in a recent Crowd React Media study on media consumption habits, watch or consume any type of news media (referred to as ‘news consumers’ in this post). This is not necessarily surprising – most people prefer to stay informed and knowledgeable of recent events. The remarkable part of this mass news media consumption is the sheer amount of time people are consuming news per day. Let’s look at the following graph to get a sense of just how news consumers are spending their time.
Graph (below): In total, how long would you say that you consume any type of news media per day?
First off, 53% of news consumers consume 1-3 hours of news media every day. What we mean by ‘news media’ is any type of news content from TV, radio, podcast, streaming, print news, online news, to news on social media platforms, etcetera. It must be noted that 23% of ages 18-39 are consuming 4-7 hours of news media per day. Combined with those consuming 8 hours or more, 35% of ages 18-39 are consuming at least 4 hours of news media per day. That is more than a third of ages 18-39 we surveyed committing a sixth of their day to news media consumption. 26% of all news consumers are spending more than 4 hours on news media per day. This is a staggering amount of news consumption!
At this point you might be asking yourself, “Well, that’s a lot of news…but what kind of news are they consuming?” Our study found that 75% of news media consumers are watching/streaming the news or news commentary. Let’s get into the data with this next graph:
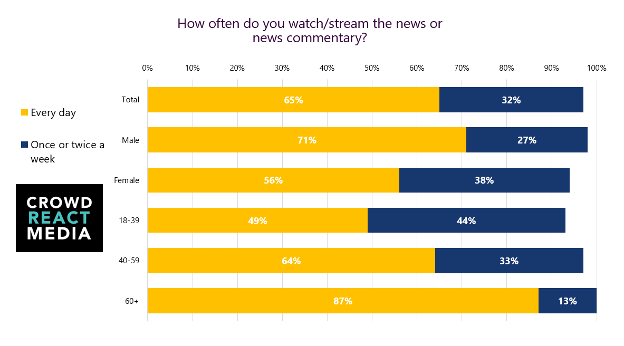
Graph (below): How often do you watch/stream the news or news commentary?
Before we get to the outliers in the above graph, let’s focus on ‘Total’. 97% of news consumers that watch the news are doing so at least once a week. What’s more notable is that the 65% of news consumers that watch the news, do so every day. That’s a significant amount of news-watching, especially factored into the average total amount of news media people are consuming. It’s no wonder that people’s daily news media consumption totals often add up to more than 4 hours. Ages 60+ watch the most news every day out of any demographic, at 87%. 100% of Ages 60+ watch the news at least once a week. Despite consuming the most news media in total, Ages 18-39 watch the least amount of news, with 49% watching/streaming every day, and 93% watching/streaming at least once a week.
Now that we now have a good idea of how often news consumers are watching the news, we might ask how exactly they are watching/streaming. The next graph can offer us some answers:
Graph (below): How do you regularly watch/stream the news? (Select all that apply)

Standard Cable/Satellite Television is still by-and-large the preferred way to watch the news, at 60%. However, App/Streaming Service is noticeably not too far behind at 52%. Ages 60+ have the highest preference for Cable/Satellite Television in watching the news, compared to 53% of Ages 18-39 who prefer Cable/Satellite Television. Ages 40-59 are even in their preference of Cable/Satellite Television vs. App Streaming Service, at 55% and 54% respectively. The younger demo of Ages 18-39 naturally prefers the newer technology, with 65% using App/Streaming Service to watch the news. Nearly a third of news-watchers does so both on Social Media Site(s)/Platforms and Laptop/Desktop Websites. 46% of Ages 18-39 watch the news on Social Media Site(s)/Platforms, indicating even further market growth for the social media titans of Facebook (70%), Twitter (42%), and YouTube (81%).
Graph (below): Which social media site(s)/platform(s) do you use to stream/watch the news? (Select all that apply)

Now that we’ve explored some ways in which people are consuming the news and for how long they are doing so each day, we can begin to form an idea of a typical news consumer. In future posts we will explore print and online/app news formats, TV channels vs. Streaming Apps, news radio formats, news/political podcasts, political campaigns, candidate polling, social media use, political/ideological affiliation, voting habits, and more! Subscribe to our newsletter to get articles like this sent to your inbox every week.
Actionable market information like the data presented in this post can be tailored to your specific research needs and targeted field of study. Do not hesitate to send any of us here at Crowd React Media an email and be sure to follow us on Twitter!
TL; DR
- Contemporary news media is ubiquitous. It factors into every aspect of our lives.
- 94% of respondents we surveyed actively consume any type of news media.
- 53% of news consumers consume 1-3 hours of news media per day.
- 23% of ages 18-39 are consuming 4-7 hours of news media per day. Combined with those consuming 8 hours or more, 35% of ages 18-39 are consuming at least 4 hours of news media per day.
- More than 1/3rd of Ages 18-39 commits at least 1/6th of their day to news media consumption.
- 26% of total news consumers are consuming more than 4 hours of news media per day.
- 75% of news media consumers are watching/streaming the news or news commentary.
- The 65% of news consumers that watch the news, do so every day.
- Ages 60+ watch the most news every day out of any demographic, at 87%.
- Standard Cable/Satellite Television is still the preferred way to watch the news, at 60%. App/Streaming Service is not too far behind at 52%.
- Ages 60+ have the highest preference for Cable/Satellite Television in watching the news, compared to 53% of Ages 18-39 who prefer Cable/Satellite Television.
- . The younger demo of Ages 18-39 naturally prefers the newer technology, with 65% using App/Streaming Service to watch the news.
- Nearly a 1/3rd of news-watchers does so both on Social Media Site(s)/Platforms and Laptop/Desktop Websites. 46% of Ages 18-39 use Social Media Sites to watch the news.
- Of the 29% of people (‘Total’) who use Social Media Platforms to watch/stream the news, 70% use Facebook, 42% use Twitter, and 81% use YouTube.


