Party Registration Doesn’t Always Reflect What Voters Believe
In a recent study conducted by Crowd React Media, we took an in-depth look at the media habits of news consumers and sports fans. Of those surveyed, 94% of respondents stated that they either watch the news or consume any type of news media. Of those that consume news media, 89% are registered to vote. In this week’s entry we will examine news consumers’ party registration and ideological affiliation. While not being wholly representative of the entire U.S., these findings should point us towards some larger trends in the news consuming electorate.
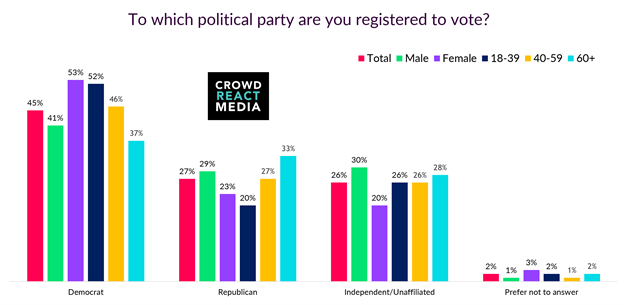
First off, let’s look at the following graph about party registration.
Graph (below): To which political party are you registered to vote?

As expected, younger ages 18-39 are most likely to be Democrats (52%). 53% of females are registered as Democrats, 12 percentage points higher than men, 41% of whom are Democrats themselves. It appears in our study that the older you are, the more likely you are to be a registered Republican or Independent, despite the overall Democratic lean of the study. An interesting side note to this heavy Democratic bent, the GOP-aligned news channel Fox News was far and away the most watched news network in our study (59%), compared to liberal, left-of-center outlets such as CNN and MSNBC (49% and 36%, respectively).
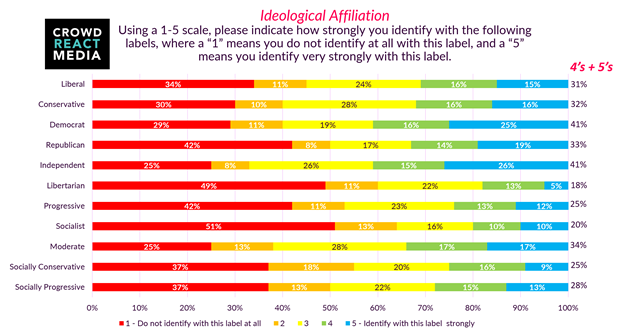
It must be noted that voter registration tells only half the story. We proceeded to ask the respondents to rank the strength of their affiliation with various ideologies/political parties and the results were diffuse. The lay voter is nuanced in the sense that their affiliations are scattered among different, often contradictory political beliefs and positions. The proceeding chart will further drive home this point.
Graph (below): Using a 1-5 scale, please indicate how strongly you identify with the following labels, where a “1” means you do not identify at all with this label, and a “5” means you identify very strongly with this label.

In accounting for strongest levels of ideological affiliation, we combined the 4’s and 5’s to best portray the results. Respondents most strongly identified as Democrats and Independents. What’s important here is that strong affiliation with the label ‘Democrat’ (41%) is noticeably less than the overall number of respondents that are registered as Democrats (45%). More striking is the increase of respondents who identify as ‘Independent’ (41%) compared to the total amount of registered Independents (26%).
After ‘Democrat’ and ‘Independent’, 33% of respondents identified strongly with the ‘Moderate’ and ‘Republican’ Labels. 31% considered themselves ‘Liberal’, whereas 32% considered themselves ‘Conservative’. Looking at a combination of 1’s and 2’s, or rather, respondents that do not at all identify with a given label, 64% percent of surveyed news consumers had little to no level of identification with the label ‘Socialist’. Behind ‘Socialist’ the labels with the weakest levels of respondent identification were ‘Libertarian’ (60%), ‘Socially Conservative’ (55%), and ‘Progressive’ (53%).
We hope that this brief overview of voter registration and ideological affiliation among news consumers has been informative. It was surely eye-opening as a researcher. Voters cannot typically be defined as merely blue or red. They hold a variety of beliefs and positions at the same time. These beliefs and positions might also simultaneously contradict one another.
Be sure to pay attention to this space for more insights and analysis on sports, news, and politics. Give us a follow @CrowdReactMedia on Twitter and sign up here for our weekly newsletter which includes blogs like the one you just read along with the latest developments in the sports, politics, and news media industry.
TL; DR
- 94% of respondents stated that they either watch the news or consume any type of news media.
- 89% of news consumers are registered to vote.
- News consumption of any kind appears to track strongly with voter registration.
- Younger ages 18-39 are most likely to be Democrats (52%).
- 53% of females are registered as Democrats, 12 percentage points higher than men, 41% of whom are Democrats themselves.
- The older you are, the more likely you are to be a registered Republican or Independent.
- Respondents most strongly identified as Democrats and Independents.
- After ‘Democrat’ and ‘Independent’, 33% of respondents identified strongly with the ‘Moderate’ and ‘Republican’ Labels.
- 31% of respondents considered themselves ‘Liberal’, whereas 32% considered themselves ‘Conservative’.
- 64% percent of surveyed news consumers had little to no level of identification with the label ‘Socialist’.
- Behind ‘Socialist’ the labels with the weakest levels of respondent identification were ‘Libertarian’ (60%), ‘Socially Conservative’ (55%), and ‘Progressive’ (53%).
- Voters cannot typically be defined as merely blue or red. They hold a variety of beliefs and positions at the same time. These simultaneously held beliefs and positions might also contradict one another.


